
A PivotTable is a powerful tool to calculate, summarize, and analyze data that lets you see comparisons, patterns, and trends in your data. PivotTables work a little bit differently depending on what platform you are using to run Excel.
Create Pivot Table
- Select the cells you want to create a PivotTable from.Note: Your data should be organized in columns with a single header row. See the Data format tips and tricks section for more details.
- Select Insert > PivotTable.
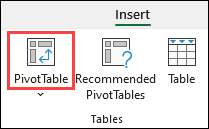
- This will create a PivotTable based on an existing table or range.
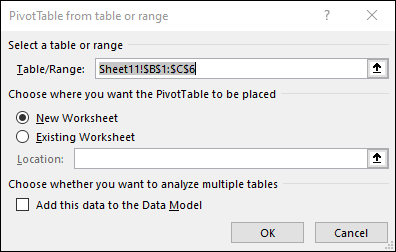 Note: Selecting Add this data to the Data Model will add the table or range being used for this PivotTable into the workbook’s Data Model.
 - Choose where you want the PivotTable report to be placed. Select New Worksheet to place the PivotTable in a new worksheet or Existing Worksheet and select where you want the new PivotTable to appear.
- Click OK.